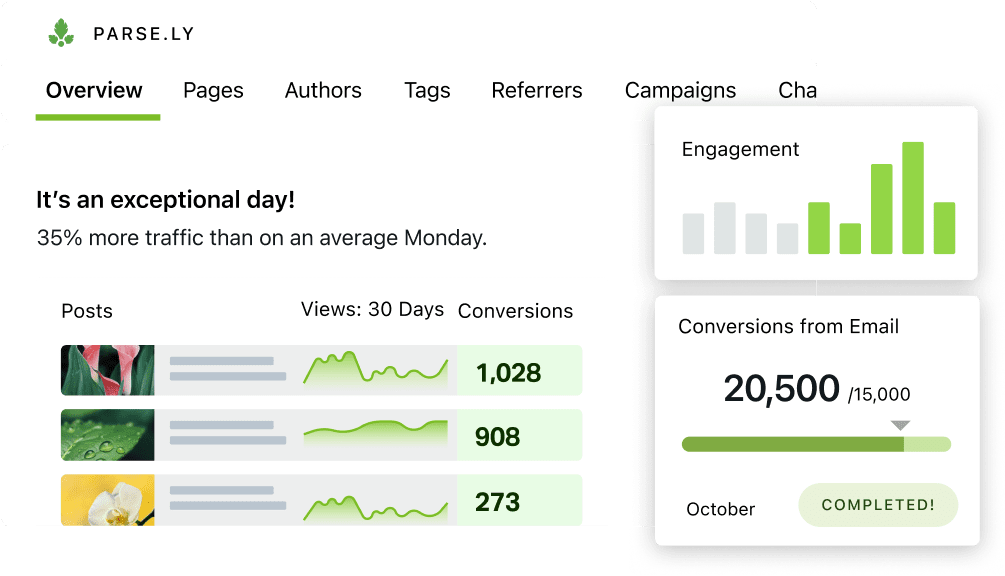
The easiest way to eliminate guesswork from your content strategy.
Parse.ly Content Analytics is the only analytics platform proven to make a results-driven culture accessible to newsrooms and content marketers.
Hello Fresh
HelloFresh’s new content strategy increased search traffic by 122%.
Network N
Insights from Parse.ly led to a site redesign resulting in 75% more revenue.
Parse.ly brings data to WordPress, so you publish better content, faster.
The Parse.ly Dashboard lets anyone drill into content performance and trends.
The Parse.ly Data Pipeline sends real-time events-level data to your data warehouse.
Cut the waste from your content strategy.
Parse.ly is super easy to use. It is configured to mirror how content is constructed and how it performs, so your creators can intuitively use the dashboard to understand how to impact their work.
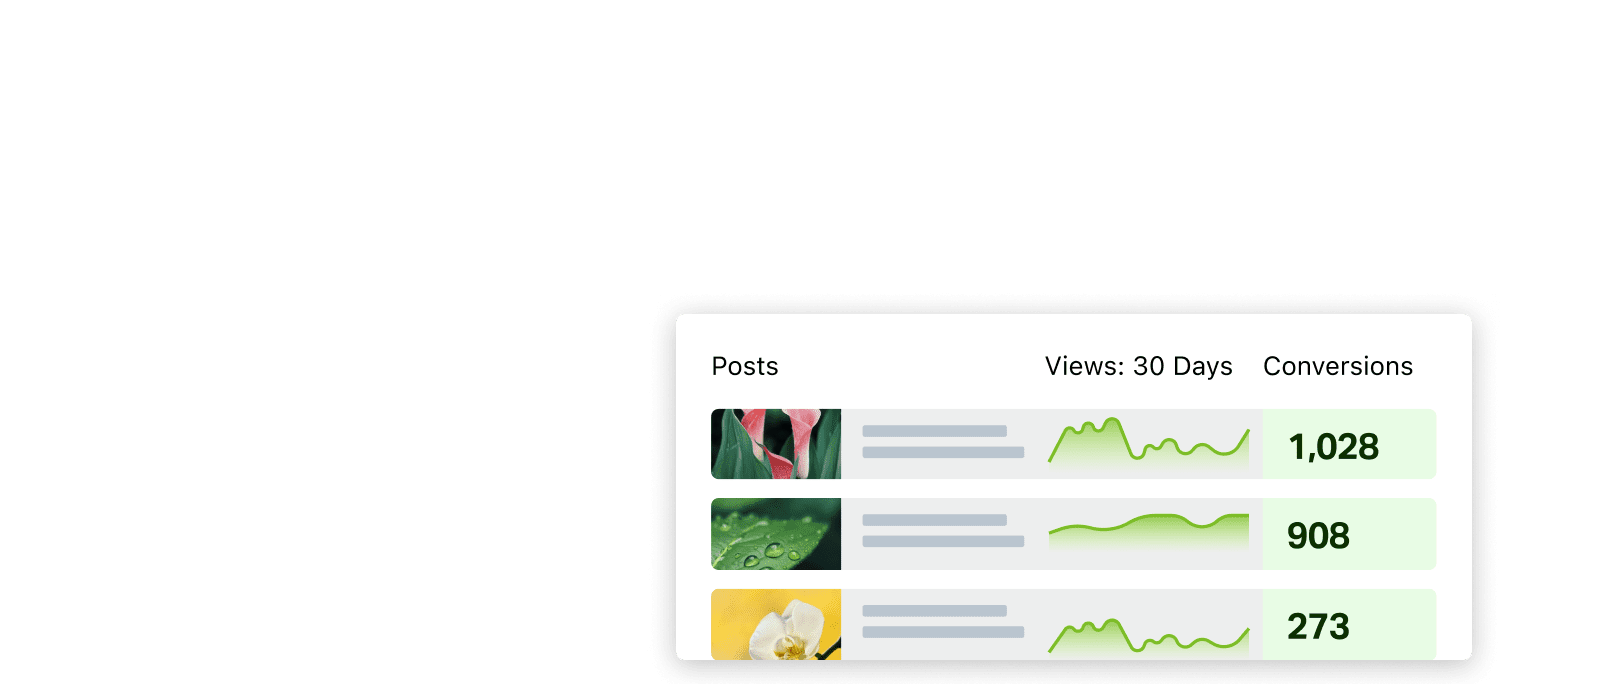
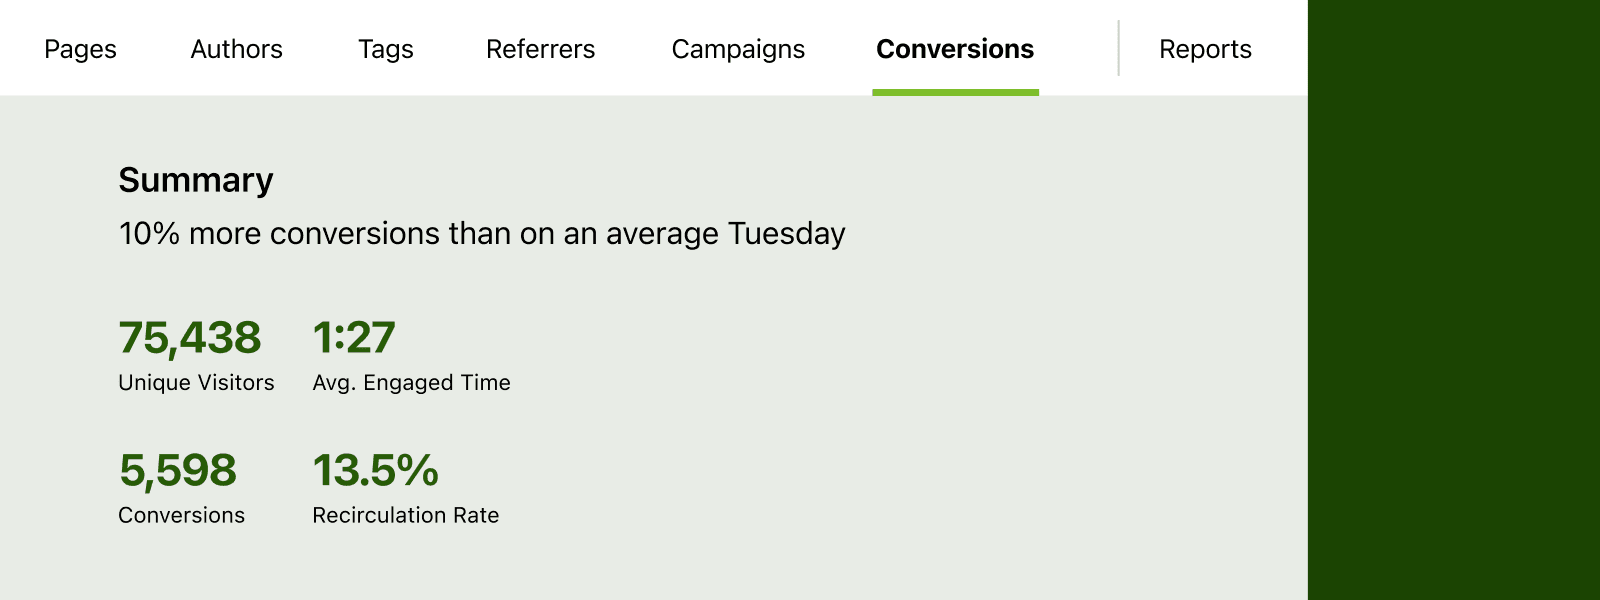
Go beyond the page view. Understand the engagement your content creates at a deeper level—know where traffic comes from, where it goes, how long it spends there, and whether it converts.

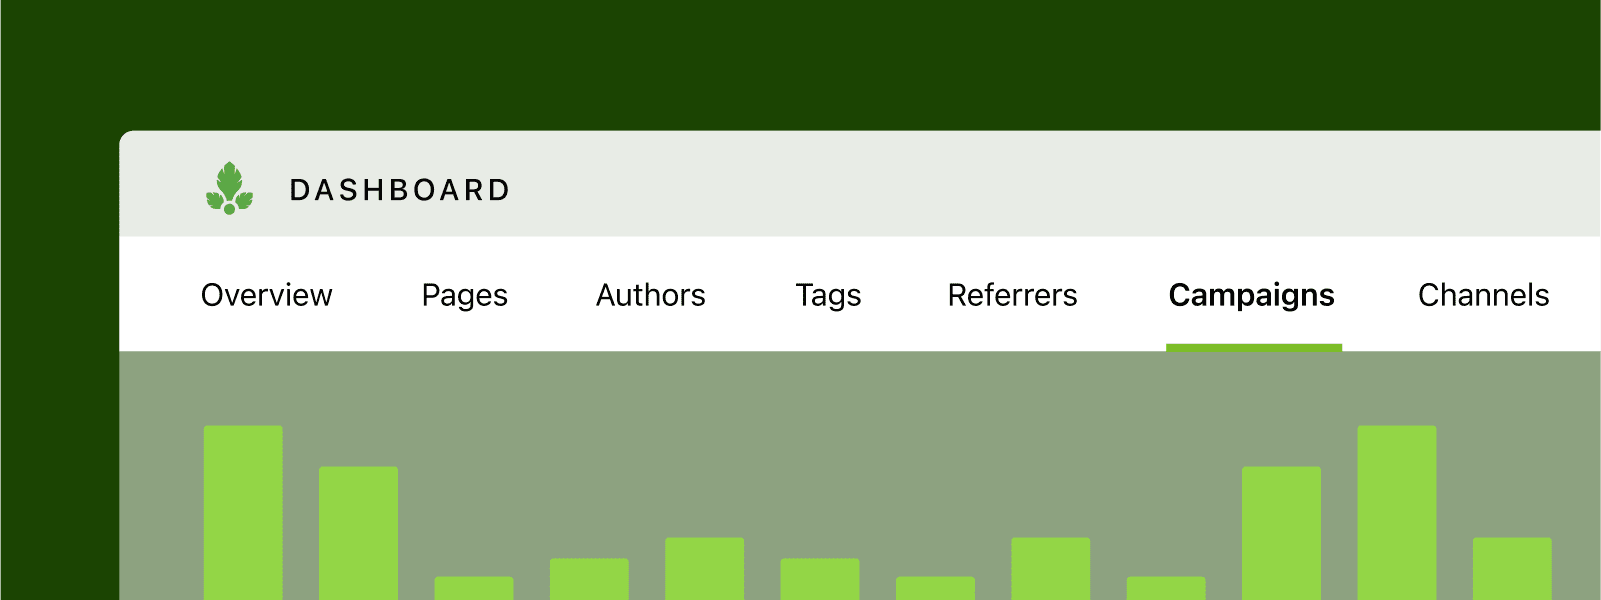
Our analytics breaks down content into categories that writers understand: topics, authors, channels, campaigns, and more. With Parse.ly, content teams’ use of data increases by more than 500%.
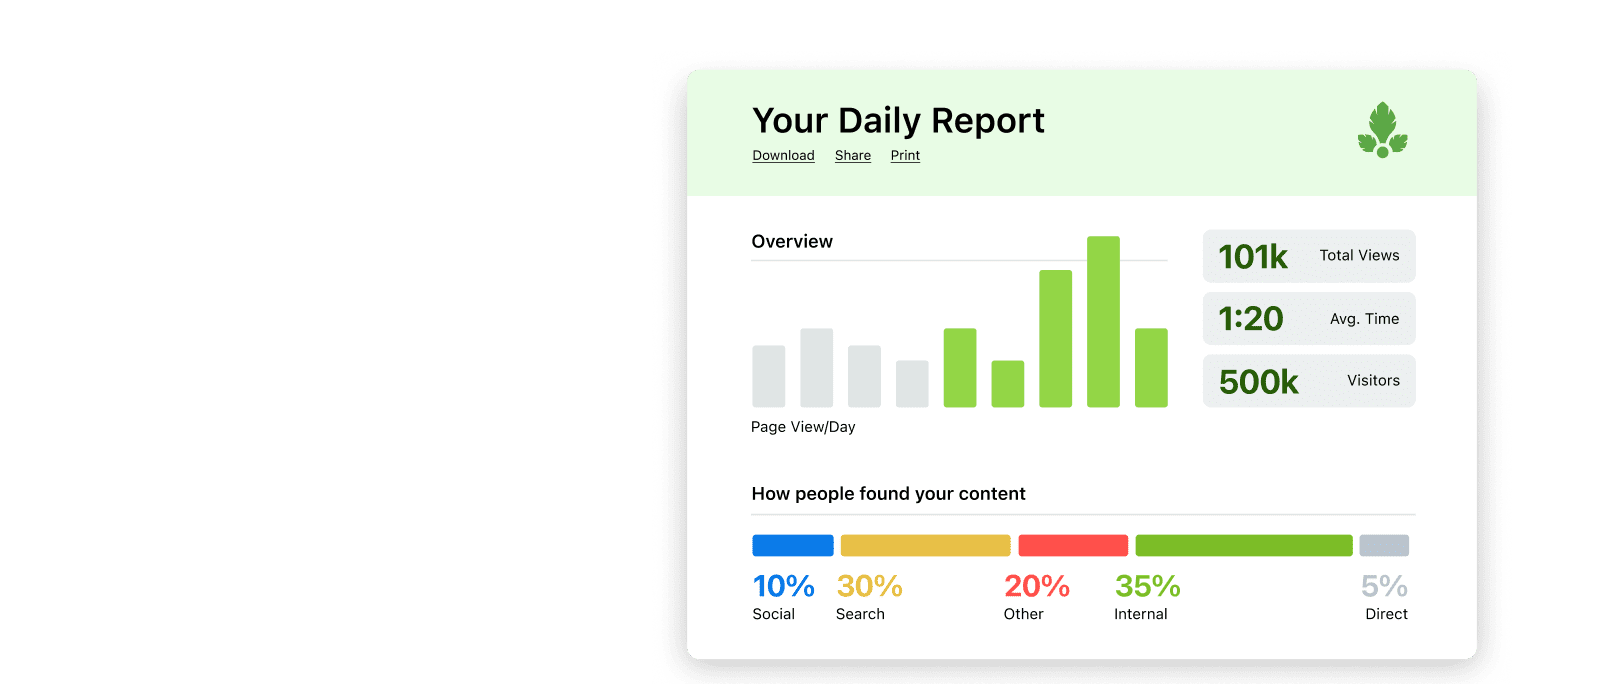

Use ready-to-share reports with powerful visualizations. Schedule them for immediate delivery or at planned intervals, straight to your email inbox or in a webpage.
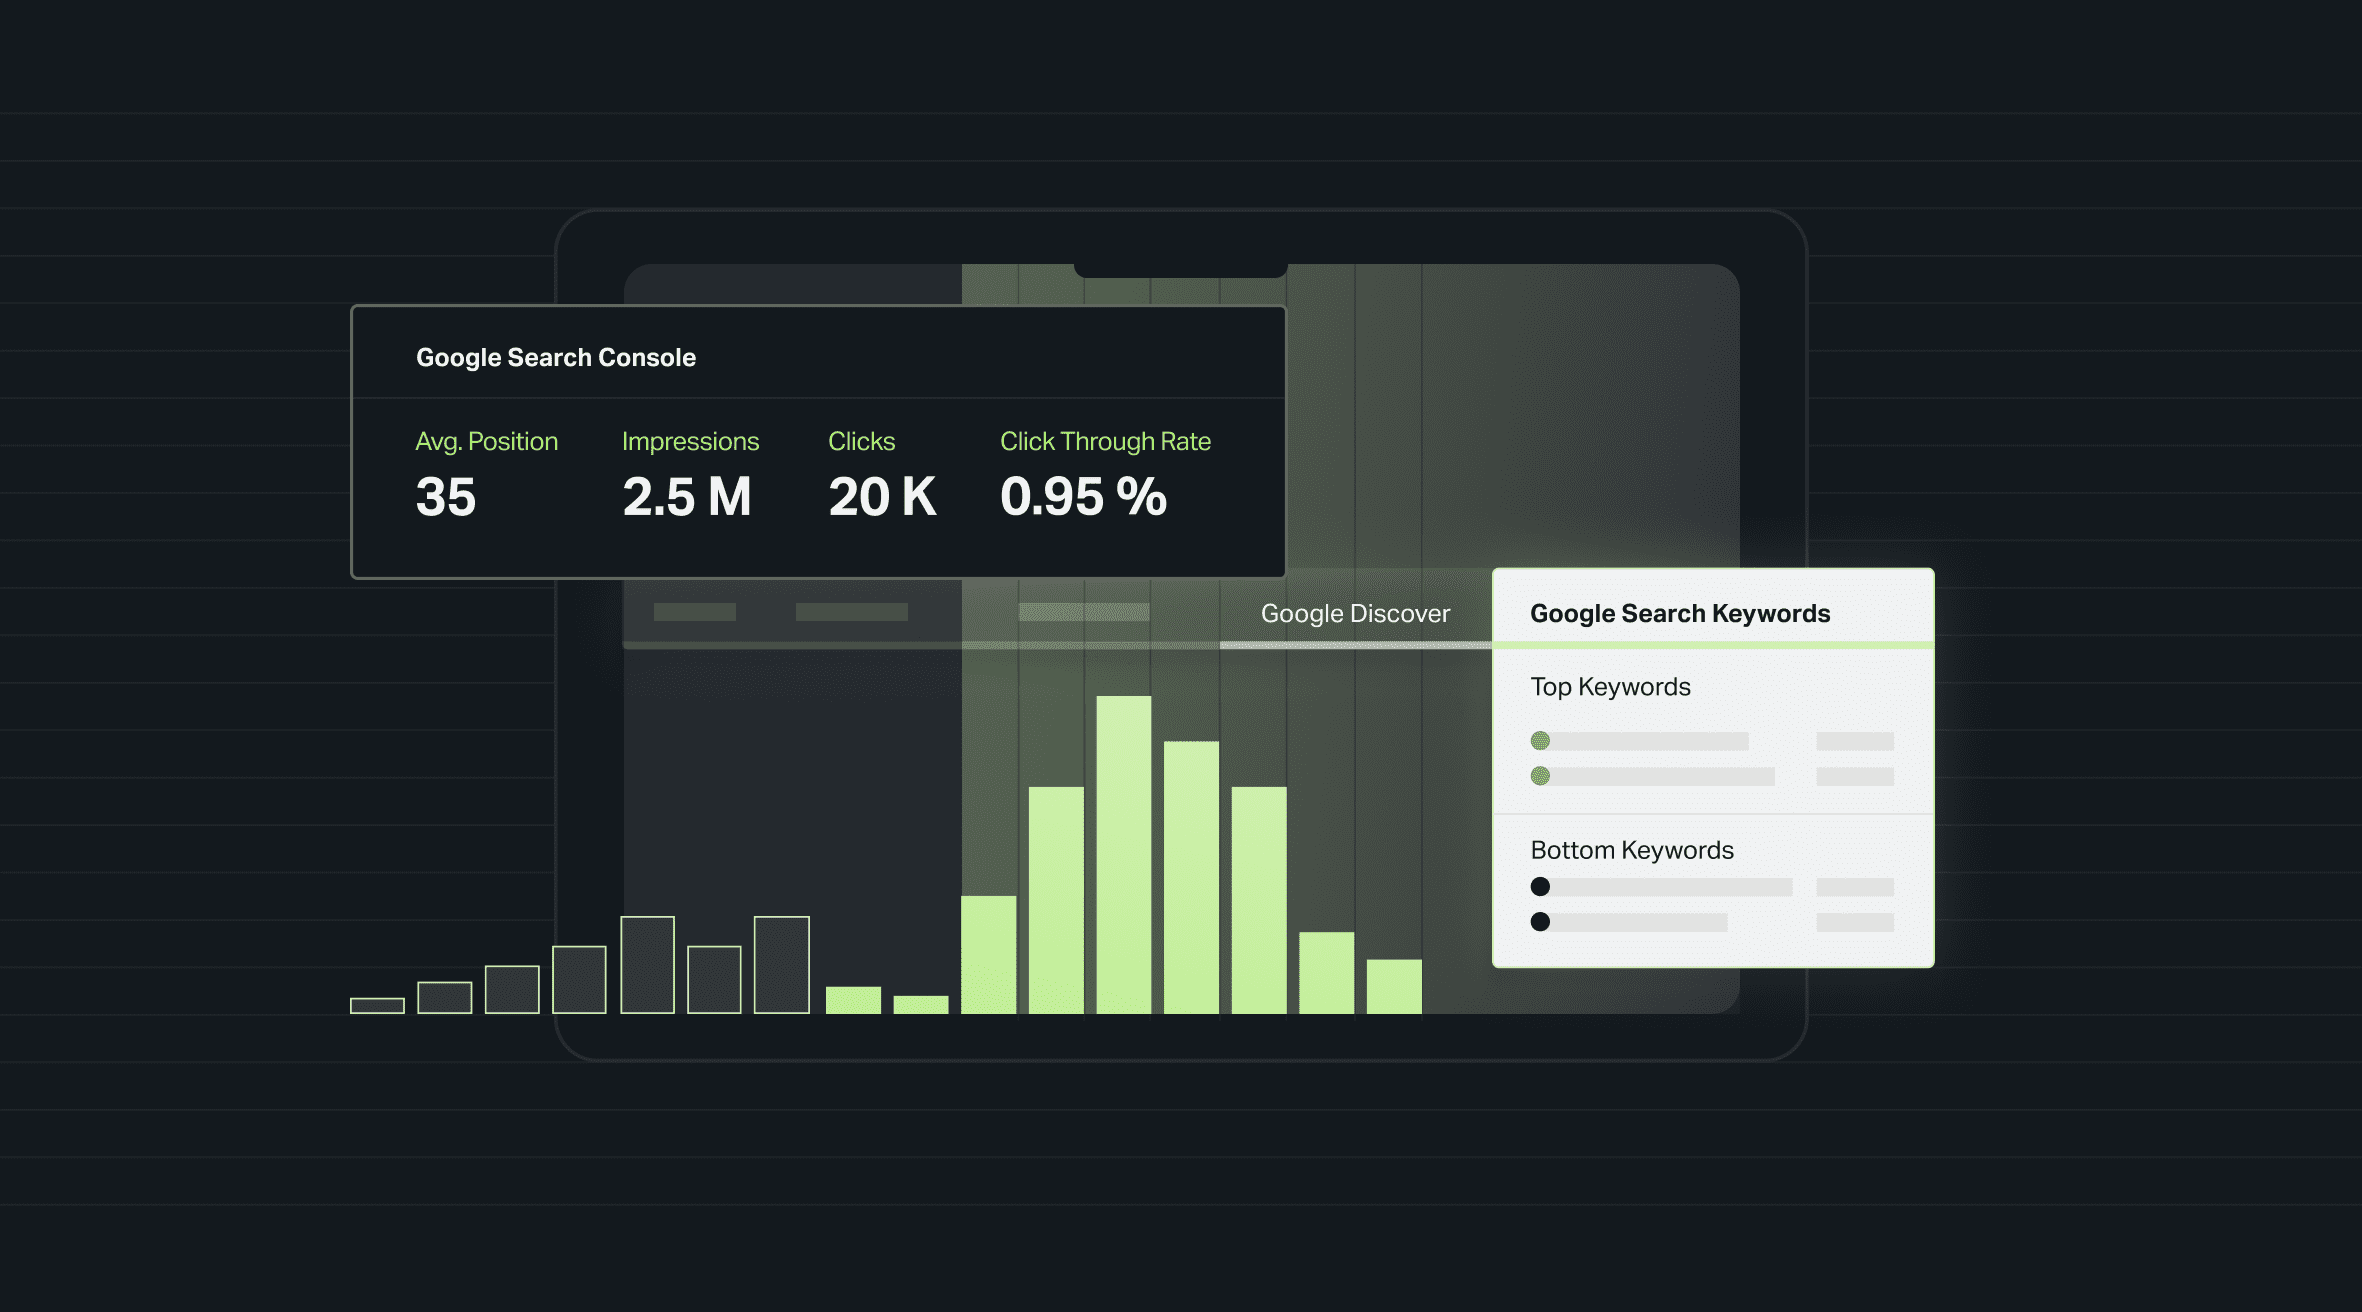
Bring keyword and search performance data to your whole team—instead of being bottlenecked by an analyst. Align your search strategy and maximize the channel.
“We chose Parse.ly because it’s so user-friendly, especially for an editor who wants to be able to report on how their content is doing right away.”
Morgan Gibson, Senior Manager of Digital Content, WeddingWire
Manage your team to ensure productivity.
Parse.ly empowers you to easily see both the big picture and the little details across your teams and brands. You can easily see what’s being published—and what’s not.

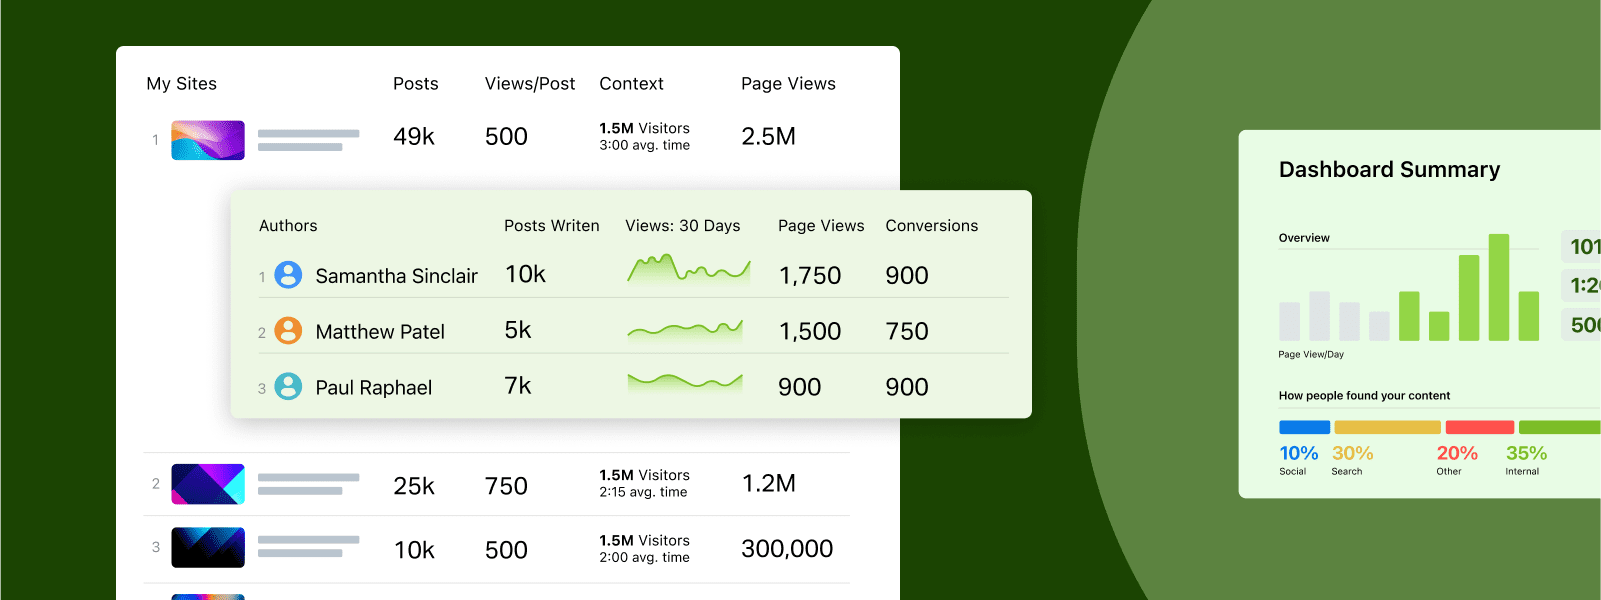
Easily see data for every website in your network at once—and then dive down all the way to individual author performance.

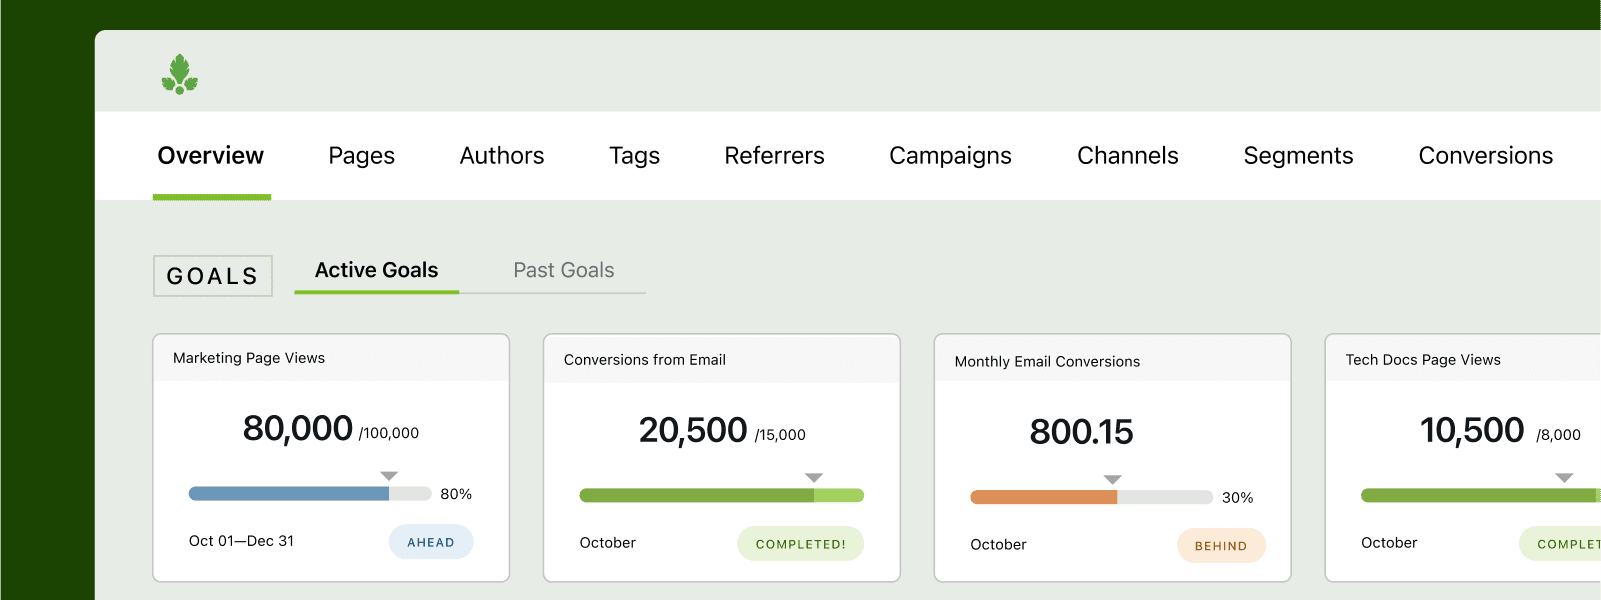
Put your KPI tracking on the homepage of the dashboard, keeping your team focused on what matters.

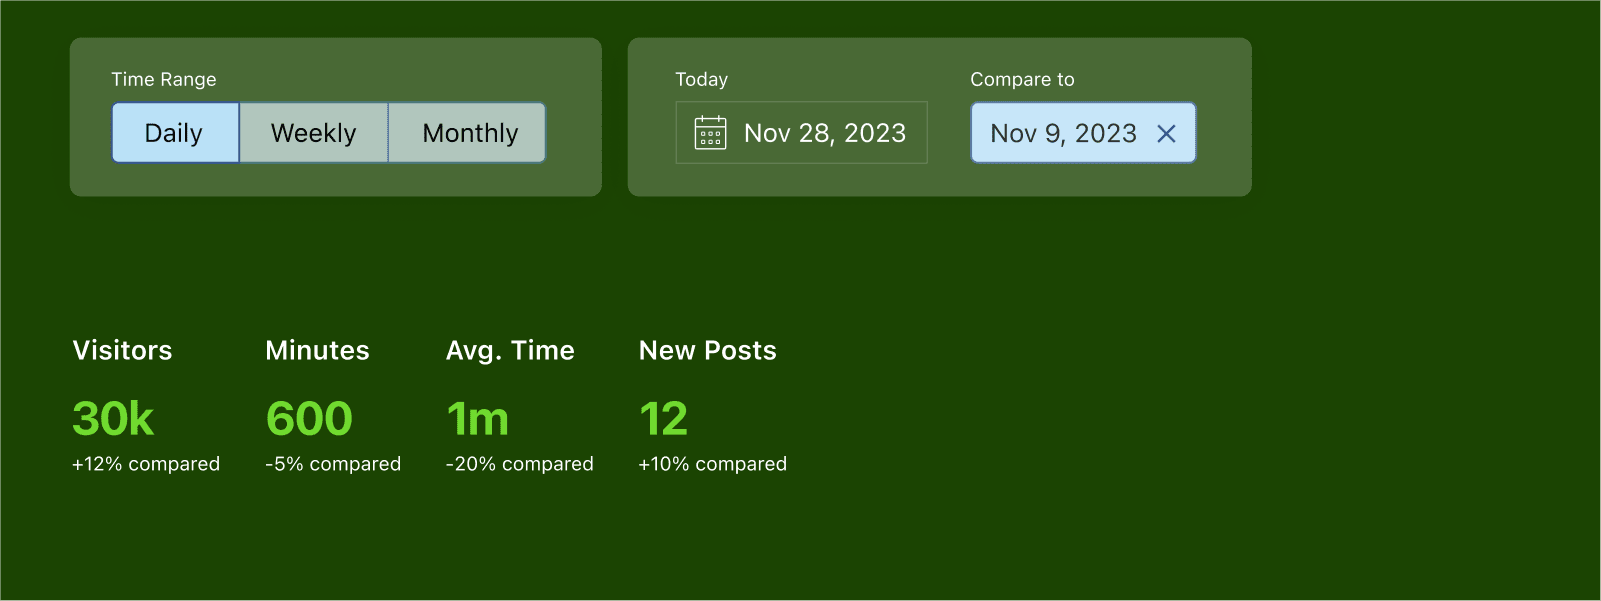
See what your team published this day (or week, or month, or year). Evaluate one time period against another, to see if changes you implemented created results.
“The ability to break things down by region—especially when cross-referenced against Parse.ly’s range of metrics like users, engaged time, social referrals, and interactions—is priceless.”
Adam Blenford, Managing Editor of Digital in Europe, Bloomberg
Stop losing out on real time opportunities.
Participate in conversations as they happen, instead of reacting afterwards.


Parse.ly data updates instantaneously—not 48 hours later. Be prepared to make the most of any surge in attention.
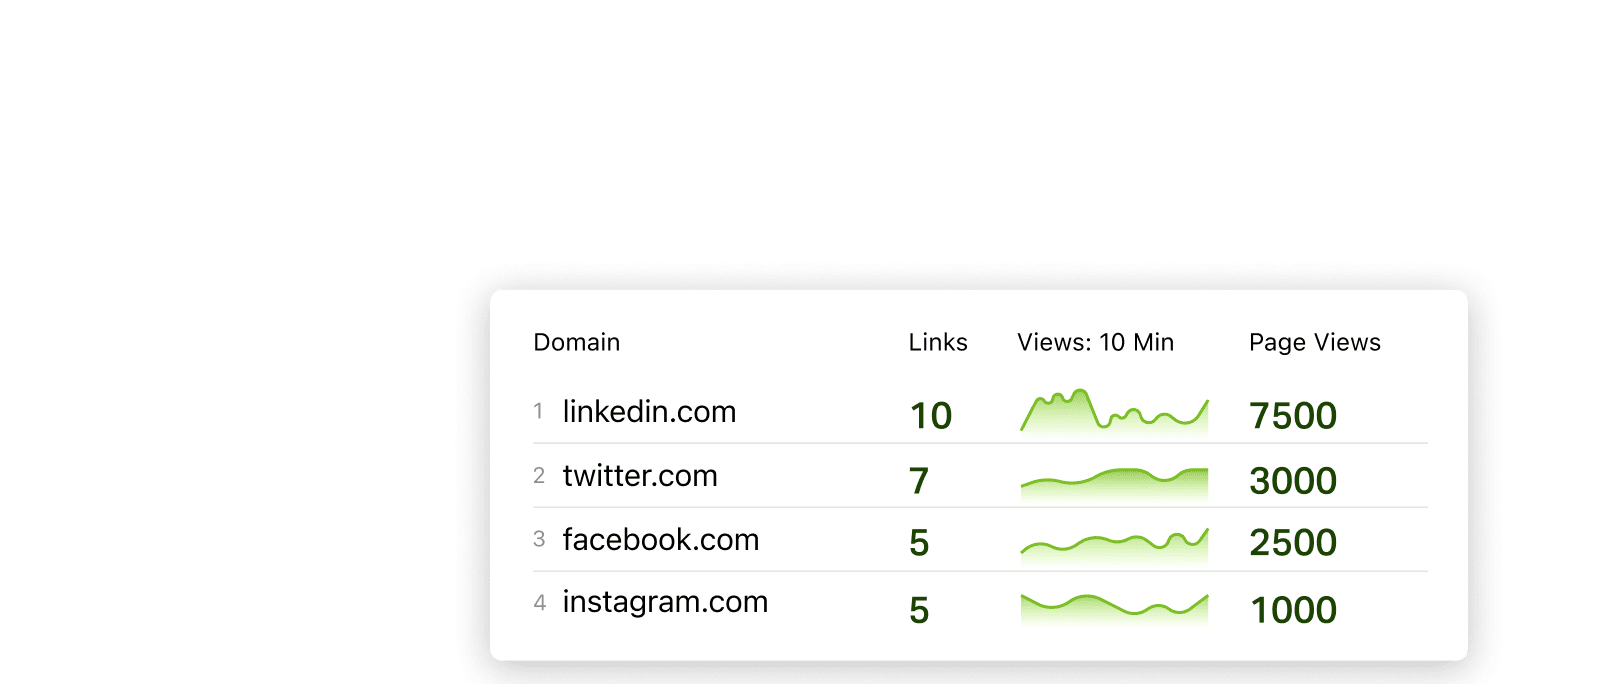

When you go viral on social, see where exactly most of your traffic is coming from so you can engage.


Get alerts to your email inbox or on Slack when traffic surges.

HelloFresh grew search traffic 122%.
50% of Slate’s total headcount use the Parse.ly Dashboard.

Network N’s data-driven redesign increased ad revenue 75%.
Wyndly’s new search strategy grew results from SEO 5300%.
PolicyGenius increased Click-Through-Rate 297%
Backstage increased conversions on content by 20%.
NAPCO increased usage of data by 412%
Gannett manages 600+ publications with one system of truth.
Savage Ventures grew visitors 121%.
Request a demo of Parse.ly Content Analytics
Learn how we can help drive audience growth and loyalty for your organization.
